Simulation & Analysis Results
Once the user clicks on ``Run Model'', EcoNet converts the model into a deterministic or a stochastic differential equation system, then solves the equation using the selected method and parameters, and performs various network analyses based on the final state of the system. Therefore, if the system has not reached near steady state, some analysis results will not be valid.
Performance of EcoNet depends on the number of other users using EcoNet with you. Therefore EcoNet informs you about its current load as follows:
 |
- LOW: More cores are available than number of users. There is no performance loss.
- MEDIUM: Some users are sharing a core. Simulations may run a little slower for some users (not all).
- HIGH: All users are sharing a core. Simulations will run a little slower for all users.
You will almost always see "LOW" when running your simulations. Rarely you might see "MEDIUM", which should not be of any concern. You can continue to work even if you see "HIGH". However, be advised that the simulations may take a little longer than usual.
In the following section, we will go over the simulation and analysis results for a simple model we presented previously. We use the default simulation method and parameters, so the adaptive step-size method (Runge-Kutta-Fehlberg) was selected with parameters Total time=100 and Sensitivity=0.001
Network Diagram
A network diagram provides important visual information which is lacking in the text-based EcoNet model format. Some modeling software use a graphical model building interface where users drag and drop geometrical shapes representing compartments and then define arrows connecting these compartments. These interfaces provide visual information, however for slightly larger systems, the finished model ends up having too many flow lines crossing each other, creating a messy visual diagram. It becomes harder to build the model, and the final look does not provide much visual information.

|
A useful diagram should provide insights on system structure and behavior by locating important stocks with many connections in the center, while keeping stocks with fewer connections closer to the edges. Flow lines should be short with little curvature, and should not intersect often. For large systems, tightly coupled compartments should be located close to each other, forming ``sub-systems''. And if possible, the locations of compartments should reflect their trophic level, even in the case of cross-level feeding.
These goals are very hard to achieve for the user who is building the model, and actually requires a sophisticated optimization algorithm. Therefore, we designed EcoNet to create a desirable network graph using Graphviz [2], a professional open source graph visualization software, to determine the optimum placement of stocks and flow lines to achieve the listed objectives. EcoNet diagrams are designed to look as clean as possible, and will work even in the case of large models with over 50 compartments and 100 flows. Trophic-level of compartments will be well-represented regardless of model size.
This diagram is in GIF format. It is perfect for web viewing, but less than desirable for publication. You can click on this figure to download the same figure in EPS format, which is a vector based format. This file is publication quality, and can be used in books or manuscripts. You can generate JPEG or GIF files of any resolution from the EPS file using free or commercial software (Adobe, Gimp, etc.).
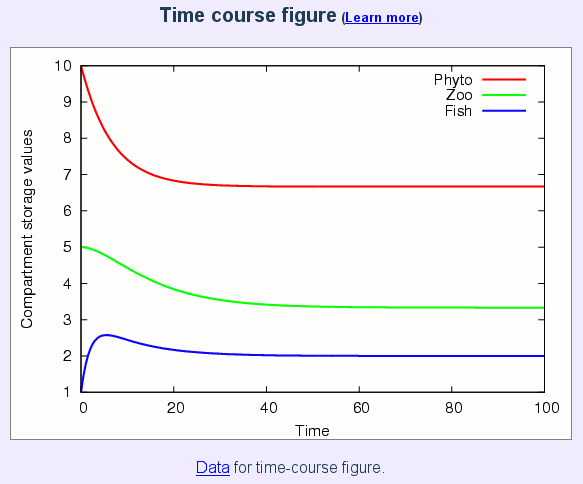
Time-course plot and data of compartment storage values
|
The second figure displayed by EcoNet is the time course plot of compartment storage values. This figure is in GIF format. It is perfect for web viewing, but less than desirable for publication. You can click on this figure to download the same figure in EPS format, which is a vector based format. This file is publication quality, and can be used in books or manuscripts. You can generate JPEG or GIF files of any resolution from the EPS file using free or commercial software (Adobe, Gimp, etc.).
EcoNet also provides access to the time-course data via a link below the figure, which points to a text file named ''state.dat''. This file contains a matrix of numerical values that EcoNet uses to form the time-course plot. Users can view the contents of the file by simply clicking on the link "Data for time-course figure" (see figure above), or they can save the file by right-clicking and choosing the ``Save Link As...'' option.This feature enables the user to import the time-course data into other software, like Matlab, Octave, Open Office or MS Office. Therefore users can easily do further analysis, or recreate the same plot using a graphing software of their choice. This is particularly important because it enables users to zoom on the graph, or plot only the compartments of interest. Therefore we would like to demonstrate how easy this is, using Matlab or Octave. Octave is a free scientific computing software similar to Matlab. Both are available for Windows, Mac and Linux operating systems; and the following procedure is the same for all platforms:
- Start Matlab or Octave.
- Download the EcoNet data as described above.
- Copy the download file ``state.dat'' to Matlab/Octave's current working directory.
- Type the following on Matlab/Octave prompt:
>> s = load('state.dat');
>> plot(s);
Users can easily zoom into this plot, add annotations, and save it in various formats. Plotting only specific compartments comes in handy when the EcoNet plot is dominated by compartments with high storage values. To plot only the first compartment, simply type:
>> plot(s(:,1));
A lot more can be done in the Matlab/Octave environment, like creating multiple plots for each compartment. However we will not go into further detail, as documentation and many tutorials are available in print and online.
Compartmental Properties
The rest of the EcoNet results are expressed in vector, scalar, or matrix format. They provide information on model structure and function, and present network analysis results. The time-course figure is followed by a table that contains the following information:
- Initial storage: Compartment storage values at the beginning of the simulation (time=0), as defined by the model.
- Final storage: Compartment storage values at the end of the simulation (time=Total time). We represent this value with xi for compartment i
- Environmental Input: Environmental input flow rate to that compartment at the end of the simulation. We represent this value with zi for compartment i
- Environmental Output: Environmental output flow rate from that compartment at the end of the simulation. We represent this value with yi for compartment i
- Throughflow-in: Sum of input flow rates, both enviornmental and inter-compartmental, into that compartment at the end of the simulation. This value should be very close to Throughflow-out if the system is close to steady state by the end of the simulation. We represent this value with Tiin for compartment i. For a model at steady-state, we define Ti = Tiout = Tiin.
- Throughflow-out: Sum of output flow rates, both enviornmental and inter-compartmental, from that compartment at the end of the simulation. This value should be very close to Throughflow-in if the system is close to steady state by the end of the simulation. We represent this value with Tiout for compartment i. For a model at steady-state, we define Ti = Tiout = Tiin.
- Residence Time: Average residence time of flow material at that compartment at the end of simulation. It is computed as the ratio of compartment Storage value to Throughflow-out (xi / Ti).
- Trophic level: The trophic level of a compartment is the position it occupies in the network.
System-wide properties
Some of these indexes depend on the analysis matrices defined below.
- Link Density: Number of intercompartmental links (d) per compartment: d/(Number of compartments)
- Connectance: Ratio of the number of actual inter-compartmental links (d) to the number of possible intercompartmental links: d/(Number of compartments)2
- Total System Throughflow: Also called Total System Throughput, it is the sum of throughflows of all compartments: TST = T1+T1+...+Tn.
- Flow (Finn's) Cycling Index: Measures the proportion of flow rates due to cycling [4, 22].
- Storage Cycling Index: Measures the proportion of storage due to cycling [29].
- Indirect to Direct Effects Ratio (Original, Realized and Revised): Measures the ratio of flows that occur over indirect connections to direct connections. The original definition [21] was later revised [28]. The latter citation explains the differences between the three versions.
- Indirect Effects Index (Original, Realized and Revised): Instead of measusing the ratio of direct to indirect flows (I/D), this index measures the proportion of indirect flows (I/(I+D)). While the ratio (I/D) may take values between zero and infinity, these indices range between zero and one. Therefore we suggest the use of these measures instead [28].
- Pure Indirect Effects (PIE): This index eliminates the high influence of cycling on indirect effects and is a better indicator of ecosystem resilience. [30].
- Ascendency: It quantifies both the level of system activity and the degree of organization (constraint) with which the material is being processed in ecosystems [23, 24 25].
- Aggradation Index: Measures the average path length. In other words, it is the average number of compartments a unit flow quantity (eg. an N atom, unit biomass, energy quanta, etc.) passes through before exiting the system [25]: TST/(z1+z2+...+zn).
- Synergism Index: Based on utility analysis, it provides a system-wide index for pairwise compartment relations. Values larger than 1 indicate a shift toward positive interactions (mutualism). It is computed as the ratio of sum of positive entries over the sum of negative entries in the utility analysis matrix U [4, 3].
- Mutualism Index: Similar to synergism index, mutualism index provides a system-wide index for pairwise compartment relations. Values larger than 1 indicate a shift toward positive interactions (mutualism). It is computed as the ratio of number of positive entries over the number of negative entries in the mutual relations matrix [4, 3].
- Homogenization Index: Quantifies the action of the network making the flow distribution more uniform. Higher values indicate that resources become well mixed by cycling in the network, giving rise to a more homogeneous distribution of flow [4].
Adjacency Matrix
Adjacency matrix A consists of 0 and 1 entries and indicates if there exists a direct flow between two stocks. In other words:

The definition of A is relatively simple, however it contains important information regarding the model structure. A sparse adjacency matrix is an indication of a loosely connected system. A row with few non-zero entries indicates the existence of a compartment receiving inputs from many other compartments. Similarly, A will contain a column with few non-zero entries if there exists a compartment with outputs to many other compartments. If A has almost all zero entries above the diagonal, then the model has a tree-structure with very little feedback. If there are well-connected smaller subsystems in a large model, A will contain dense non-zero square blocks close to the diagonal.
Stoichiometric Matrix
Entries of the stoichiometric matrix can be 0, -1 and 1. The entry (i,j) indicates how the storage value of compartment i change when flow j occurs.
Note that the Adjacency matrix contains only inter-compartmental relationships. Stoichiometric matrix contains the flows between the system and the enviornment as well. Therefore the stoichiometric matrix alone is enough to define network topology.
Stoichometric matrix is named as "state shift matrix" in [10], where you can find a compact form of the differential equation governing system dynamics in terms of the stoichiometric matrix and the "propensity vector" (flow kinetics).
Flow Matrix
In addition to connectivity information, F also provides information on how strong the connections are. As the compartment storage values change in time, the rate of flow between compartments also change accordingly. Flow rates reach a steady state with the storage values. F shows the flow rate between compartments at the end of the simulation. Assuming that the model reaches steady state at the end of the simulation:

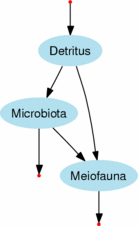
Ecological Network Analysis
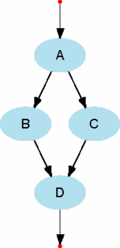
The flow matrix F represents the connection strength between compartments at steady-state. However, even if two compartments are not directly connected, they can still affect each other through indirect connections involving other compartments. For example, there are no direct flows between compartments A and D in the next figure below. However any change in compartment A will eventually affect compartment D. In this regard, even the model diagram below can be viewed as misleading because it only represents the direct flows. Particularly in well-connected systems, there is often a greater contribution from indirect flows than from direct. This property is called the dominance of indirect effects [4,17].
|
EcoNet uses Network Environ Analysis (NEA) [4,17] to quantify the actual relation among compartments, environmental inputs and outputs. Unlike most analysis methods, NEA treats the system as a whole and provides an elegant way to quantify the effects of all indirect flows in the system. NEA is not a one-step analysis, but a series of algebraic operations resulting in scalar and matrix values representing various system-wide properties. First version of EcoNet performed storage (S), throughflow (N) and utility (U) analyses. EcoNet 2.0 added many new analysis results.
Some of the analysis results are valid only when the system is close to steady state. EcoNet displays results based on the final state of the system. To get accurate results, users should use the time-course plot (and/or throughflow values) to make sure that the system is close to steady state by the end of the simulation.
Throughflow Analysis
The definition of throughflow is given compartmental properties. Nij represents how much of the environmental input to compartment j is received by compartment i. Note that this input may reach to compartment i through indirect flows that involve many other compartments, and Nij accounts for all such possible paths.
|
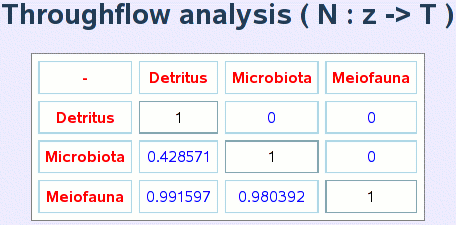
Let's consider the first column of matrix N given in the figure above. Obviously 100% of the environmental input to Detritus is received by Detritus, therefore N11 = 1. Coefficient N21 = 0.428 means that 42.8% of the environmental input to Detritus is received by Microbiota, then 57.2% flows to Meiofauna. Coefficient N31 = 0.991 represents the fact that Meiofauna eventually receives 99.1% of the environmental input (to Detritus), through Microbiota and directly from Detritus. Then we can also conclude that 0.9% of the environmental input returns back to the environment through dissipation at Microbiota.
To compare the effect of direct and indirect paths from an input to a compartment, EcoNet displays another matrix G, defined as follows:
Comparing N and G matrices (previous two figures), we see that entries of both matrices match except for:
| Direct Flow: | Detritus -> Meiofauna |
| Indirect Flow: | Detritus -> Microbiota -> Meiofauna |
Both are accounted for in N31 = 0.991, while G31 = 0.571 only represents the direct flow. Then we can conclude that 100x(0.991-0.571)/0.991 = 42% of the interaction between Detritus to Meiofauna occurs over the indirect connection.
EcoNet provides two more matrices in its "Extended Results": G' and N', titled as "input oriented". Similar to G, G' is defined as follows:
N' = (I-G')-1
Storage Analysis
Storage analysis matrix S represents the relation between input flow rates and compartment storage values. In the figure above, only Detritus receives a direct environmental input. This input is partially transferred to Microbiota and Meiofauna through indirect flows. Sij represents how much of the storage value of compartment i is contributed by a unit of direct environmental input to compartment j.
|
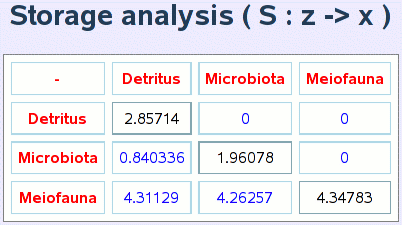
Let's consider the first row of the storage matrix S:
There are no environmental inputs into Microbiota and Meiofauna, therefore the storage value of Detritus depends only on its own environmental input ( S12=S13=0). The environmental input rate to Detritus is 10 units/time, and the steady-state storage value of Detritus is 28.57 units. Therefore, for 1 unit environmental input to Detritus, contributes to S11=2.857 units of storage value in Detritus.
Similarly, the storage value of Microbiota (8.4 units) is all contributed by the environmental input to Detritus; therefore S21=8.4/10=0.84. Although the environmental input to Microbiota is 0 units/time in our model, S22=1.96 means that each unit of direct environmental input to Microbiota would contribute to S22=1.96 units of storage value. The fact that S23=0 informs us that an environmental input to Meiofauna will never affect the storage value of Microbiota.
We should note that if there were an additional flow from Meiofauna to Detritus, there would be no zero entries in S, as any environmental input would cycle through all compartments, contributing to all storage values.
EcoNet provides "input oriented" storage analysis matrix S' in "extended results".S'ij represents how much of the storage has to be generated at compartment j for a unit output from compartment i. S and S' are computed as follows:
S' = -C'-1
Cii = Ti / xi
C'ij = Fij / xi
Cii = Ti / xi
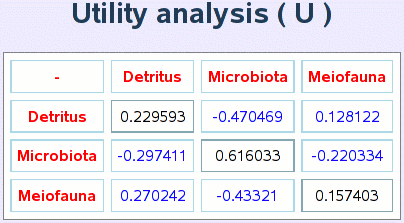
Utility Analysis
Utility analysis quantifies "mututal relations" among compartments, again including indirect effects. Here's a simple example:

|
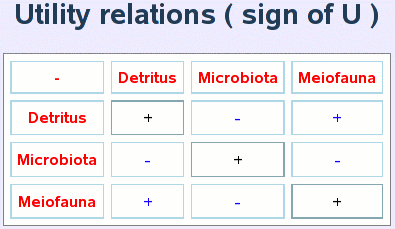
|
The second matrix above represents the relations among compartments in +/- format, while the first matrix U provides the quantitative relation strength as well. The three compartment model we provide here is too simple to present the strength of utility analysis. We postpone this discussion to the next section where we analyze John M. Teal's Georgia salt marsh model. S and S' are computed as follows:
Ecological Control Analysis
Coming soon.Eco-Exergy Calculator
Eco-exergy is a thermodynamic indicator for ecosystems. It measures a system's deviation from chemical equilibrium. The definition of eco-exergy involves Kullback’s information measure. Therefore one needs the "β-values" for the compartments used in their model. Once the user enters these values in the provided spaces, eco-exergy will be computed instantaneously and displayed on the last line. A table for β-values for commonly compartments and more information on eco-exergy is available in the references [26, 27, 25].Next: An example: Georgia salt marsh energy flow study using EcoNet
DHTML Menu By Milonic JavaScript